In my research, data visualization is an essential skill, and I use Matplotlib extensively for this purpose. However, for a long time I felt that I was just using Matplotlib rather than truly understanding it. Every time I needed to create a plot, I could make it work, but the underlying logic always felt opaque.
This motivated me to study Matplotlib more systematically. Instead of focusing on usage details or memorizing APIs, I tried to understand its design philosophy and internal logic. These notes summarize what I learned along the way.
1 Matplotlib’s Two Programming Paradigms
One of the first sources of confusion when using Matplotlib is that there seem to be multiple ways to create a plot. After digging into the documentation, I realized that Matplotlib intentionally provides two programming paradigms: the state-based interface (pyplot) and the object-oriented interface. In the official documentation, these are called the implicit and explicit interfaces, respectively ( (see quick start documentation, full documentation)).
To understand Matplotlib properly, it is best to start with the explicit (object-oriented) interface, because the implicit interface is essentially built on top of it.
The core elements of a figure considered by Matplotlib are:
- Figure: the entire image, i.e. the canvas that holds everything
- Axes: the actual plotting area where data is drawn (a figure can contain multiple axes)
The main plotting or drawing happens inside the Axes, and Axes live inside a Figure.
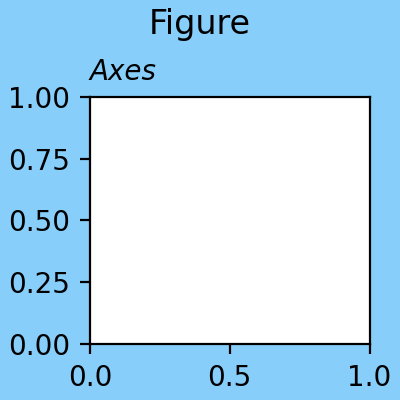
This is often the confusing part. In everyday English, axes is the plural of axis. In Matplotlib, however, Axes refers to the plot area itself, not the x-axis or y-axis. They invented this term probably because a plot area always contains two axes (x and y). So remember: Axes = plot area, Axis = x-axis or y-axis.
The object-oriented interface requires users to explicitly create these objects and manage their relationships:
import matplotlib.pyplot as plt

fig = plt.figure()  # Create a Figure object
ax = fig.add_subplot(111)  # Add an Axes to the Figure

# the above code can also be written as:
fig, ax = plt.subplots()  # Create a Figure and Axes

ax.plot(x, y)  # Plot data on the Axes
plt.show()  # Display the Figure
This is very easy to understand: the thing we want to use Matplotlib to create is always an Axes inside a Figure, and we do plotting on the Axes.
In contrast, the state-based interface (pyplot) abstracts away the Figure and Axes management, allowing users to create plots with a simpler syntax:
import matplotlib.pyplot as plt

plt.plot(x, y)  # Plot data directly
plt.show()  # Display the Figure
Everything begins directly with functions in the pyplot module, without explicitly creating Figure or Axes objects.
Under the hood, pyplot manages these objects for you, creating them as needed. It maintains a global state that keeps track of the current Figure and Axes, so when you call plt.plot(), it automatically adds the plot to the current Axes in the current Figure. If no Figure or Axes exist, it creates them automatically.
Until now, we can tell the pyplot interface is just a convenient wrapper around the object-oriented interface, designed to make simple plotting tasks easier. I personally prefer the object-oriented interface for its clarity and explicitness. If I write codes for other people to read, I always use the object-oriented interface.
2 Why Is matplotlib.pyplot Always Used?
I’ve been using Matplotlib for such a long time, and I always saw code snippets that started with the following import statement, seemingly a standard practice:
import matplotlib.pyplot as pltBut what about the other modules in Matplotlib? Why is pyplot always the entry point?
After reading the documentation, I found that this matplotlib.pyplot is the entrance to all operations to create plots in Matplotlib. As we have seen above, in the object-oriented interface, we need to use plt.figure() or plt.subplots() in this module to create Figure and Axes objects; while in the state-based interface, pyplot directly provides the set of functions that operate on the implicitly created Figure and Axes. Other modules in Matplotlib, includes matplotlib.figure, matplotlib.axes, matplotlib.lines, etc., provide the definitions of these objects and their methods. However, these modules are not typically used directly by users. Instead, users interact with these objects through operations all included in matplotlib.pyplot. That is why pyplot is always imported as plt and used as the main interface to Matplotlib.
3 Components of a Figure (Artists)
The components in a Matplotlib figure are all called “Artists”. According to the documentation, an Artist is anything that can be drawn on the Figure. From now on, I will use the term “Artist” to refer to these components.
From the highest level to the lowest level, the hierarchy of Artists is as follows:
- Figure: The top-level container for all plot elements.
- Axes: The area where data is plotted.
- Axis: The x-axis and y-axis of the plot.
- Tick: The markers on the axis indicating specific values.
- Tick Label: The text labels associated with each tick.
- Tick: The markers on the axis indicating specific values.
- Line2D: The lines representing data points in the plot.
- Text: Any text elements in the plot, such as titles and labels. …
- Axis: The x-axis and y-axis of the plot.
- Axes: The area where data is plotted.
Understanding this hierarchy is crucial for effectively using Matplotlib to create complex visualizations. Each of these Artists has its own properties and methods that can be manipulated to customize the appearance of the plot. Again, these are all defined classes in various modules of Matplotlib, but users typically create and manipulate them through the matplotlib.pyplot interface. In fact, all operations can be done by calling methods on fig or ax. That’s why the standard way of using Matplotlib is to always create fig and ax first, then call methods on them to customize the plot:
fig, ax = plt.subplots()
ax.plot(x, y)
ax....
fig....
plt.show()
For example, to customize the x-axis ticks, you would use methods from the Axes object, which in turn manages the Axis, Tick, and Tick Label objects:
ax = fig.add_subplot(111)
ax.set_xticks([0, 1, 2, 3])  # Set x-axis ticks
ax.set_xticklabels(['A', 'B', 'C', 'D'])
To add a title or background color to the entire figure, you would use the Figure object’s method:
fig.suptitle('My Figure Title')  # Set the title for the entire figure
fig.set_facecolor('lightgray')  # Set the background color for the entire figure
4 Types of Plots
Matplotlib provides a variety of plot types (see plot type list), including line plots, scatter plots, bar charts, histograms, and more. Where is this concept of plot type embedded in Matplotlib?
In fact, it’s not what we might think that: each type of plot corresponds to a different class, i.e., a subclass of the Axes in the inheritance tree. Instead, the concept of plot type is associated with a collection of different Artist objects added to the Axes. For example, a line plot is created by adding Line2D objects to the Axes, while a histogram is created by adding multiple Rectangle objects to the Axes. To create such Artists and add them to the Axes, Matplotlib provides a set of plotting methods for the Axes objects. For example, the ax.plot() function creates Line2D objects for a line plot, while the ax.hist() function creates Rectangle objects for a histogram.
The ax.plot() seems misleading. Please be aware that this “plot” does not refer to the “plot” as in Figure” or Axes, but specifically to the line plot type. The ax.plot() method can be only used to create line plots by adding Line2D objects to the Axes.
In a word, plotting different types of plot are achieved by adding different combinations of Artist objects to the same Axes class, and these operations are packed by single function calls, forming what plot types are defined as in Matplotlib.
Why doesn’t Matplotlib create different subclasses of Axes for different plot types? That is because there are so many types of plots sharing common components (i.e. Artists). Matplotlib is designed to be highly flexible and extensible. In this design logic, users can easily combine different plot types and customize them without being constrained by rigid class hierarchies. This design allows for greater versatility in creating complex visualizations.
5 Things Need to Know About Output
The final step of using Matplotlib is to output the figure. In the codes using Matplotlib, all the variables are just in the memory of Python, and will be destroyed when the program ends. To get the figure permanently, we have to explicitly show it on the screen or save it to a file (it’s worth noting that these output methods are called output backends and there are more than show and save).
The plt.show() function is used to display the figure in a window:
plt.show()It is interesting that this method does not belong to the Figure or Axes classes, but is a function in the pyplot module. If we look at many Matplotlib codes, they all use plt.show() instead of something like fig.show(), no matter if the object-oriented interface or the pyplot interface. This is confusing thing for us, but it is related to the design of Matplotlib’s backend system, but I don’t want to dive into this. We just need to remember that the plt.show() function takes care of rendering all figures and displaying them in separate windows. However, if we want to save the figure to a file, we use the fig.savefig() method of within the Figure class.
6 Summary
I think I have covered the main logic of Matplotlib. There are so many details and settings to plot data visualization figures, but once we understand these concepts, using Matplotlib becomes much easier. The rest is just learning the APIs and practicing.
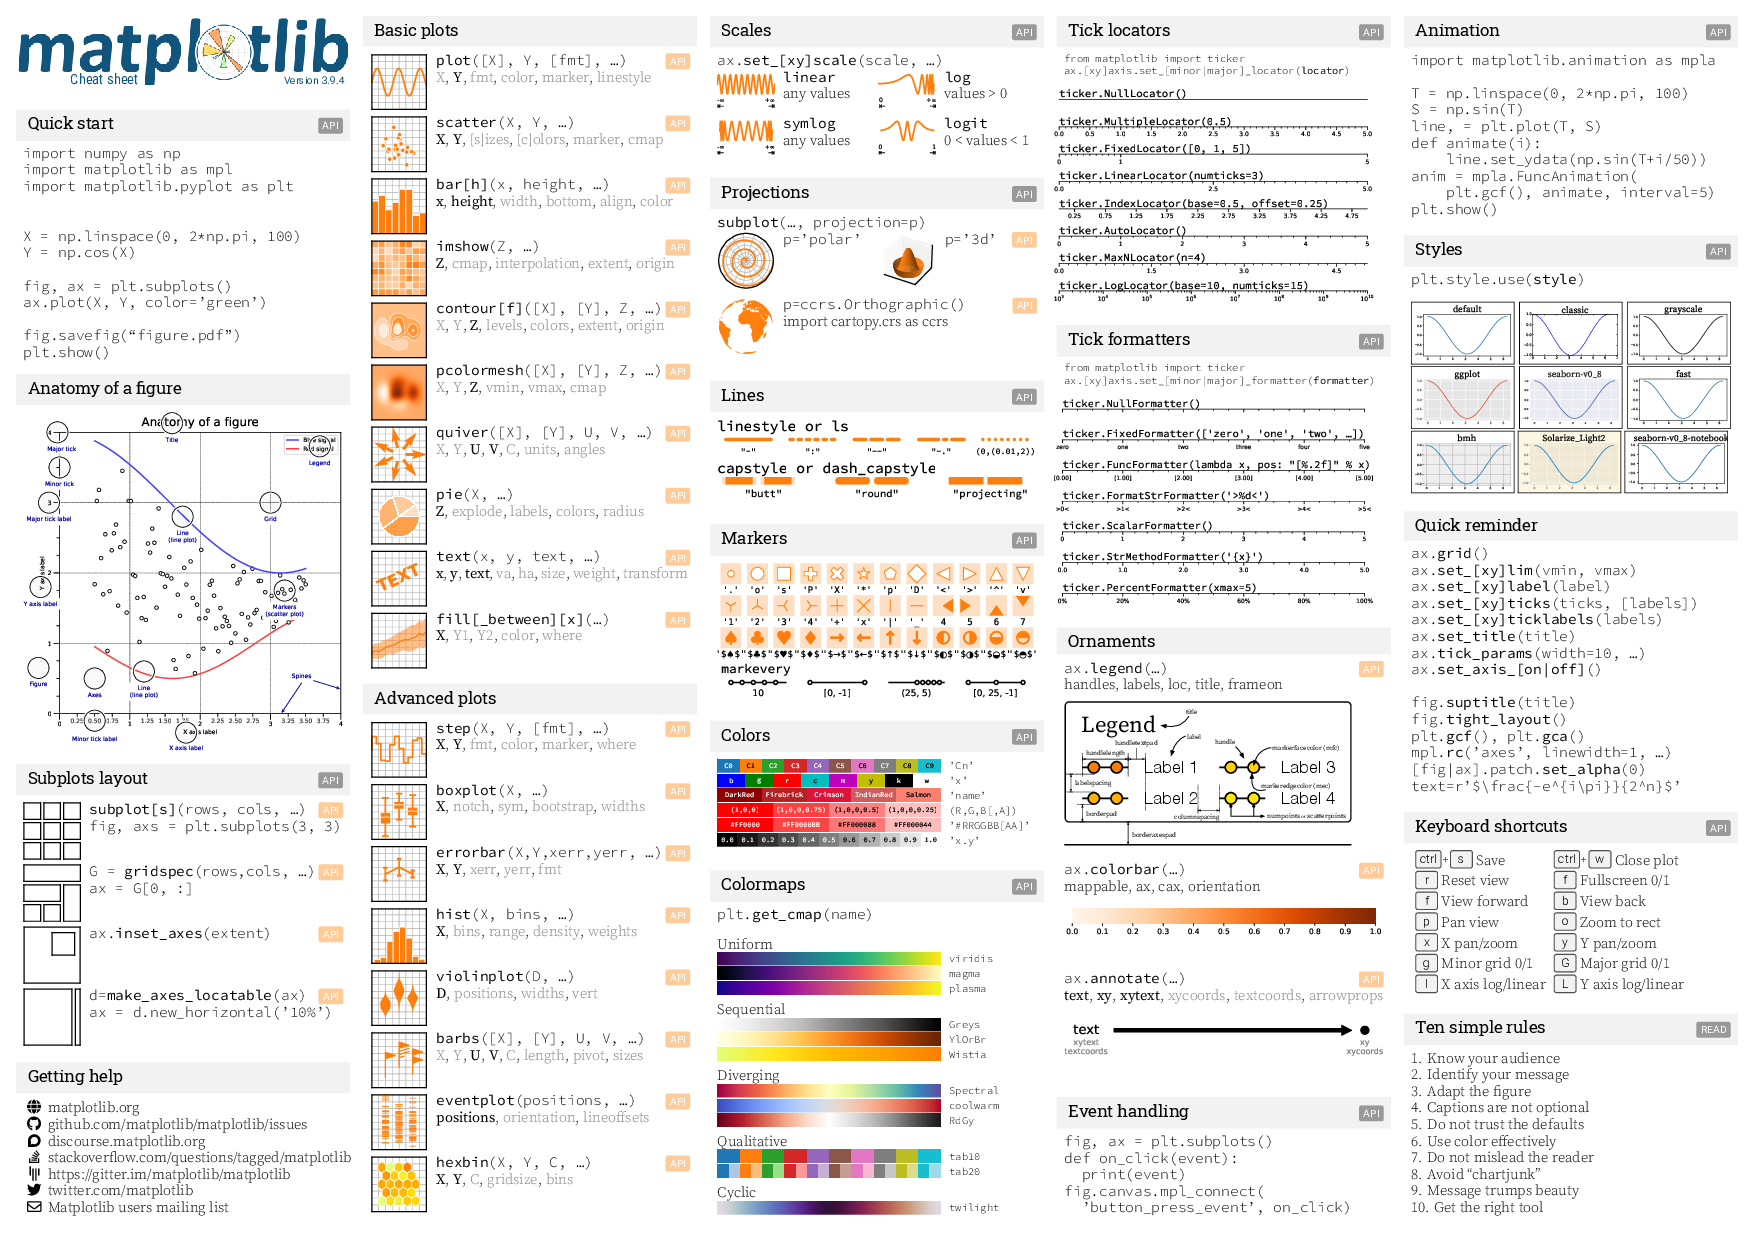
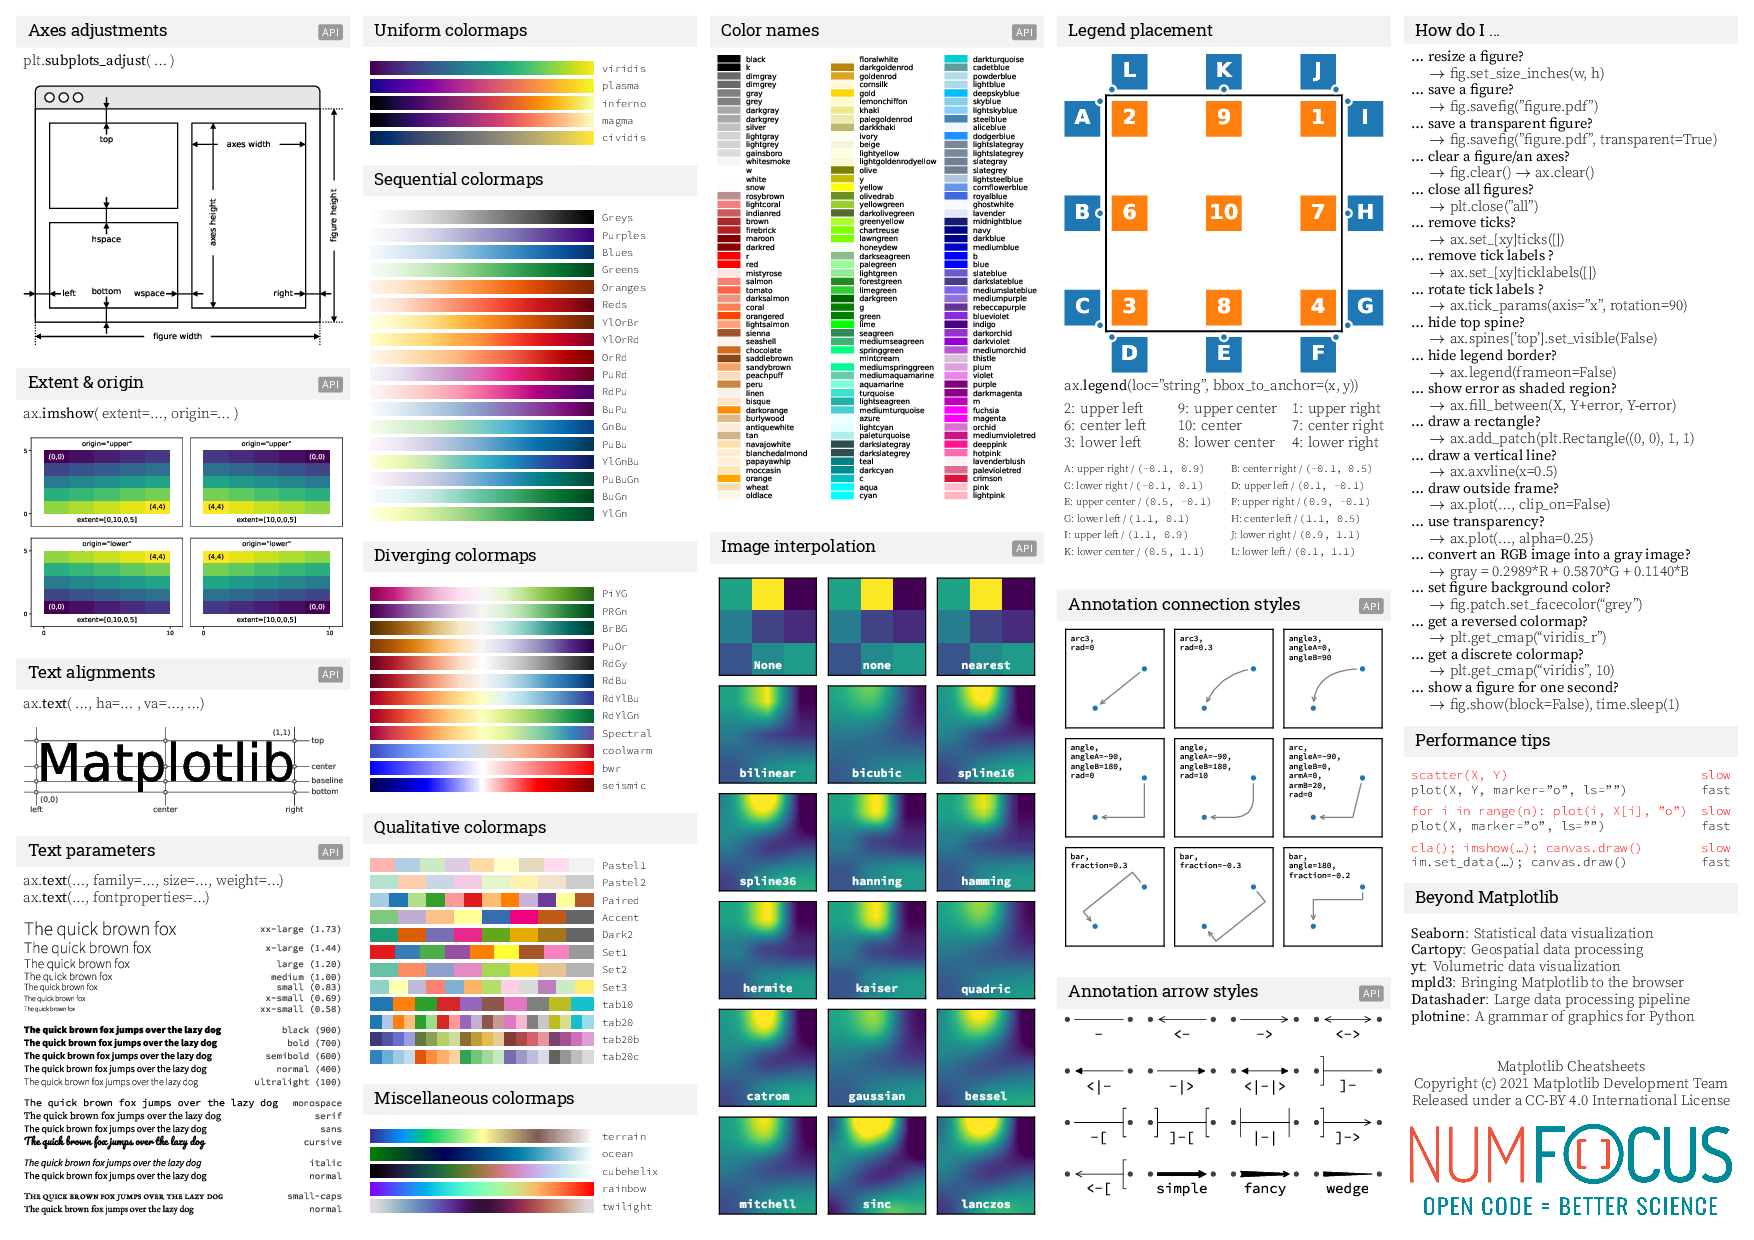
Last but not least, here is something I found very useful: the official cheatsheets. I know cheatsheets are designed to provide quick references, but It doesn’t make a lot of sense to me before I took some time writing this article. Now I can get to use it instantly to find what I need. I hope you can make good use of it after reading this article too!